-
Overcoming Maths Aversion: Using DataViz to explain statistical concepts
Episode 1
How to use Data Visualisation to explain statistical concepts to a lay audience, and translate your data science insights into language that engages people.
-
 30:07Episode 2
Aim, Audience, Alert. Result: Action
Episode 2
Numerous data visualisations are developed everyday which see little to no use and result in no impact. Producing effective, actionable dashboards require an appropriate design mindset and the correct business engagement.
Key topics:
- Specific end user in mind
- Purpose for user to use dashboar... -
 39:08Episode 3
From Headlines to Headway
Episode 3
The world of data is expanding rapidly, and change is coming. Analysts and businesses around the world are realising our roles and use of data are evolving, and we must evolve with it. This presentation addresses recent headlines on data and the impact these concerns can have on the modern busine...
-
 33:47Episode 4
Visualising Organisational Networks
Episode 4
Visualising informal connections and identifying hidden influencers inside an organisation.
-
Best Practice and Tooling in Google Data Studio
Episode 5
An overview of what's possible, and advice on getting started with this free reporting and data visualisation tool.
-
Exploring Open-Source and Commercial Data Visualisation Tools
Episode 6
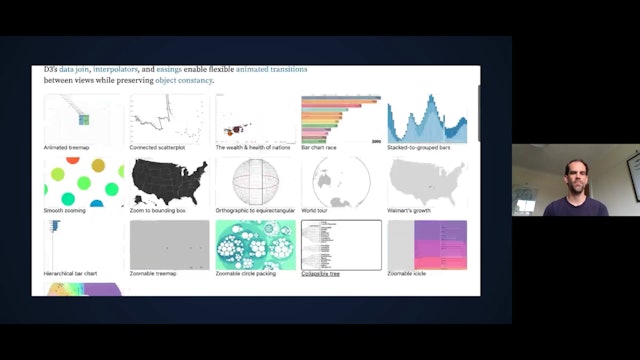
Data visualisation tools grow in number, spectrum and sophistication. This talk aims at providing a brief overview of the space from low level programming languages to high level click and show tools.
Key topics:
The tool space
- Programming languages
- Online Templates
- Vector tools
- Special... -
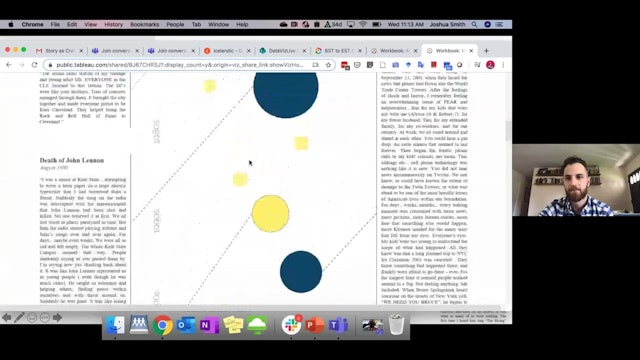
Story as Craft: Narratives and Data (Joshua Smith)
Episode 7
Joshua Smith - Analytics Manager, CoverMyMeds
We call a lot of DataViz work "stories", but let's be honest - most of the time, DataViz audiences don't walk away from our work as moved as after a trip to the movies. What are we missing? How do stories compliment data to help our users understand ...
-
Building Internal Data Visualisation Communities
Episode 8
Most successful companies strive to be data-driven organisations in order to grow and achieve success. We'll look at the importance of an organisational data culture and how a data community can really help achieve this from the ground up.
Key topics:
- Data culture
- Internal and External data... -
Making Public Data Accessible and Useful for All
Episode 9
-
Learning as we Go: How we Manage DataViz Teams
Episode 10
I co-manage a Belfast-based Data Visualisation team, working on Consulting projects across the UK. If you've ever led a data viz team, you'll know that it isn't always plain sailing; training, resourcing and empowering team members is an ongoing commitment. Our team is still learning as we go, bu...
-
 54:47Episode 11
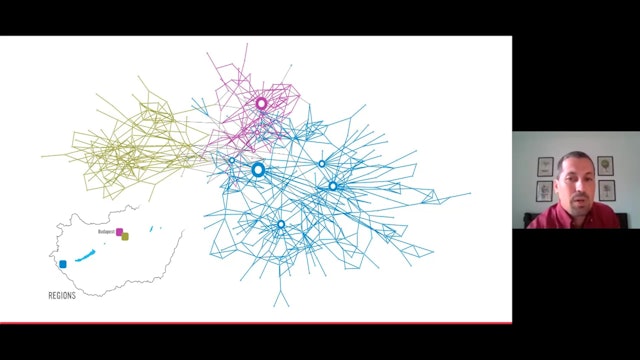
Visualising Connections
Episode 11
Connections are a part of us, of the world. From the connections between people, between cultures, within language, and more. In these days when more data is collected daily than we could ever hope to explore, the variety in connections being gathered is opening up the possibility to visualize th...
-
Structure, Consistency, Speed: How JLL Architected their Viz Design
Episode 12
How do we help our clients & people see and understand data? We standardised. Empowering analysts with consistent and considered guidelines, world class training and the sharing of community innovation, we have elevated design skills to deliver calm, elegant visuals that communicate accessible in...
-
Data Literacy: What the Heck is it and Why is it so Important?
Episode 13
Sarah Nell-Rodriquez - Principal High Touch Customer Success Manager, Salesforce
Data Literacy is a popular word these days. Go to any data chat, and you'll see these two words bandied about by many. Some argue about the term itself, and others compare it to data visualisation skills. With so ma...
-
 40:02Episode 14
Key Traits of High-Performing Analysts
Episode 14
The practical steps you and your team can take to take to improve your stakeholder engagement, and elevate your impact and productivity.
Drawing on his 30 years of experience managing, training and coaching analysts across a breadth of disciplines and industries, Steve shares the common key mind...
-
Beyond Colour Myths: Functional Aesthetics for Better Design
Episode 15
How much does colour affect our understanding of dashboards? We know bad choices in palettes can definitely break a good dashboard. Join Bridget to learn about avoiding poor colour choice, and how to use function aesthetics to enhance your visualisations.
-
 34:59Episode 16
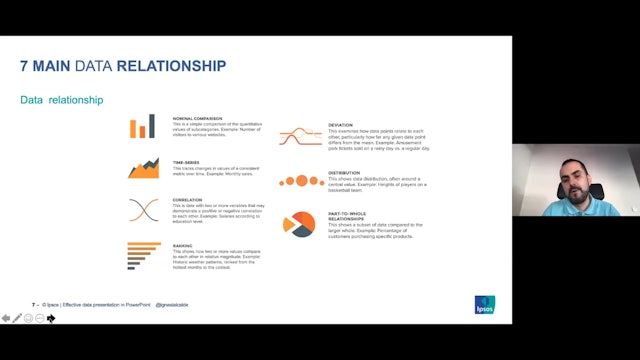
Effective Data Presentation in PowerPoint
Episode 16
Clever Ways to Present Data Effectively in PowerPoint
Data presentation tips and tricks, and learn how to properly dissect data and visualise charts and tables, to to create clean and effective data presentation in PowerPoint.