DataVizLive - Event Recordings
Overcoming Maths Aversion: Using DataViz to explain statistical concepts
35m
How to use Data Visualisation to explain statistical concepts to a lay audience, and translate your data science insights into language that engages people.
Up Next in May 2020
-
Aim, Audience, Alert. Result: Action
Numerous data visualisations are developed everyday which see little to no use and result in no impact. Producing effective, actionable dashboards require an appropriate design mindset and the correct business engagement.
Key topics:
- Specific end user in mind
- Purpose for user to use dashboar... -
From Headlines to Headway
The world of data is expanding rapidly, and change is coming. Analysts and businesses around the world are realising our roles and use of data are evolving, and we must evolve with it. This presentation addresses recent headlines on data and the impact these concerns can have on the modern busine...
-
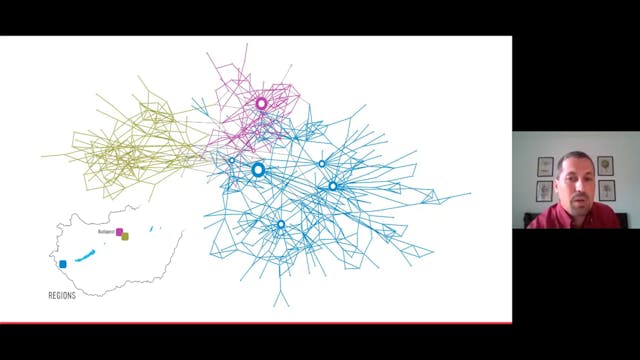
Visualising Organisational Networks
Visualising informal connections and identifying hidden influencers inside an organisation.