DataVizLive - Event Recordings
A Practical Guide to Balancing Data Socialisation and Data Governance
28m
Helen Himmelman (RS Components)
RS is part of Electrocomponents Group:
• 6,600 employees globally
• 32 countries globally (Allied in USA)
• 1 million+ customers
Challenges:
• Domo in it’s infancy (~800 users) – want to scale
• Organic growth different skill levels, processes, etc.
• Silos Duplication Inconsistencies
• Overall the instance was messy and users were confused
• Not seeing all the benefits of having the platform
• Real life examples
Goal – make it clear, concise, and easy.
What did we do?
Background
• Major changes from Aug 2019
• Changed the role permissions
• Make training mandatory
• Always involve InfoSec
Transparency, Communication, and Collaborate to tackle our challenges – breaking down silos and driving our processes etc. as the CoE to provide consistency and ease of use, along with engagement.
Transparency
• Domo Catalogue
o Dashboard of Dashboards
o User Map
o DataSets
o Metric Lexicon
o Key Dashboards
• Auditing
o Naming and Tagging
o Exception check dashboard
o Alerts
o Activity Log
Communication
• Loads of training adjust training to be role-specific and level up full teams to participant level
• Domo Days
• Deep dives
• Advanced training from technical success manager
• Drop ins
• Webpage (SharePoint)
• Streamline data connections – take key sources and write quick guides
Collaboration
• Ambassadors group – know and work with all key users, and have them work together
• Case studies
• Forum (Yammer group)
• Data models – bring in and manage key tables and let users join them to their own data (e.g. exchange rates), but let key users own their own models and share them out
Success:
• User growth
• Less but better content
• Interactions between teams and cross-department project teams
• Users sharing cards
• Faster turn around times
• Will try to gather a few stats around new revenue, productivity gains, savings
Next:
• More quick guides
• More advanced features of the platform
• More culture change to have viz driven meetings
• More users – now at x users (y variance from Aug 2019 when we launched all of our actions from the presentation)
• SVA – find out the value of our work
What you will learn:
Transparency, Communication, Collaboration.
1. Provide full visibility to all users – vulnerable but useful
2. TRAIN TRAIN TRAIN
3. Create a one stop shop for all information
4. Connect people and let them build the relationship
5. Make it clear who to go to
Up Next in February 2020
-
Enabling the Analysts: From Apprentic...
Suitable for leaders within BI/Data Analyst departments in organisations, as well as analysts.
Within large organisations, typically analysts lack the opportunities to be more involved in their projects, losing out on the opportunity to grow within an organisation by providing more visually enga...
-
Solving Some of the World's Biggest C...
For: Any organisation that has unstructured data (images, media, documents) and wants a completely new way of understanding trends using a combination of AI and powerful visualisation.
Whilst developing analysis methods to understand cancer images we developed a new way to understand trends in u...
-
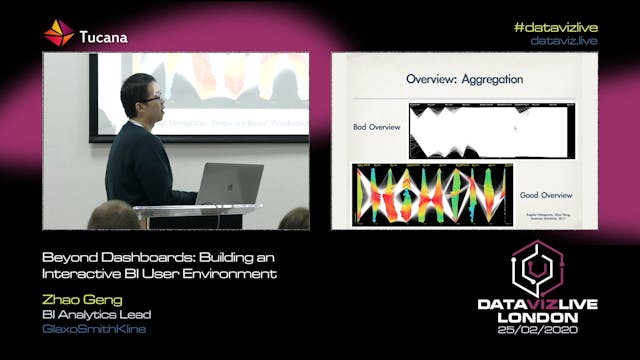
Design and Principles in Exploratory ...
For this talk, I will focus on the design principles and guidelines when developing a dashboard for business to better align with the visual Information-Seeking mantra, namely ‘overview first, zoom and filter, detail on demand’. A few of the theoretical studies will be discussed to avoid some maj...