For this talk, I will focus on the design principles and guidelines when developing a dashboard for business to better align with the visual Information-Seeking mantra, namely ‘overview first, zoom and filter, detail on demand’. A few of the theoretical studies will be discussed to avoid some major design pitfalls
- Visual Information Seeking Mantra
- Visual Continuity
- Focus+Context
- Preattentive Perception
- Color Mapping
Explore options and techniques to achieve better data visualizations for exploratory purposes.
Up Next in February 2020
-
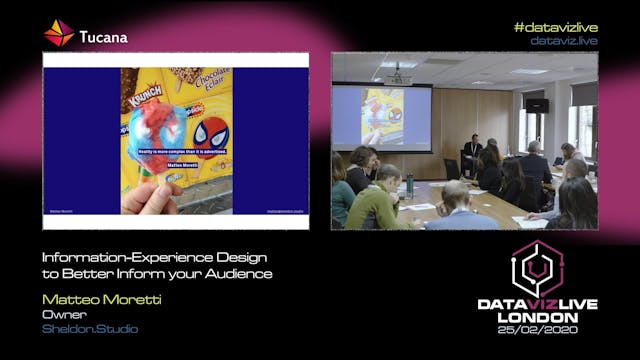
Information-Experience Design to Bett...
Engage and inform your audience with immersive and memorable deisgn experiences
Through a series of case study across the industry and the academic research, the talk will show the results of six-years long research across information, design, and experience design, to design projects that infor...
-
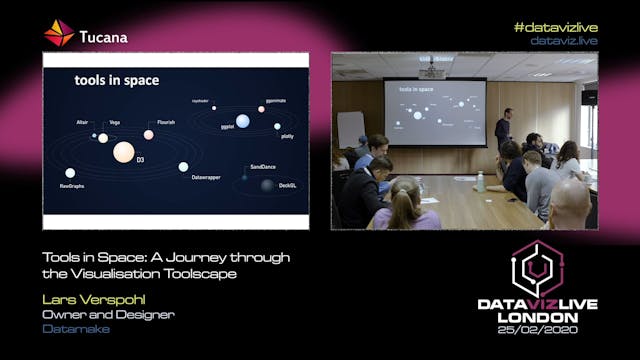
Tools in Space: A Journey through the...
Data visualisation tools grow in number, spectrum and sophistication. This talk aims at providing a brief overview of the space from low level programming languages to high level click and show tools.
- The tool space
- Programming languages
- Online Templates
- Vector tools
- Special mentions...
-
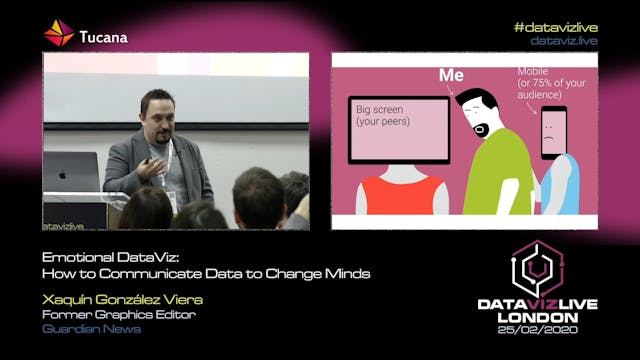
Emotional DataViz: How to Communicate...
How do we connect humans and data about humans? In a world of abundant data about events, about changes in our social and physical environment, making sense of the noise, annotating the chaos is a fundamental communication task.
Data-driven visual storytelling is a powerful way to affect people’...