Best Practice and Tooling in Google Data Studio
Skills
•
35m
An overview of what's possible, and advice on getting started with this free reporting and data visualisation tool.
Up Next in Skills
-
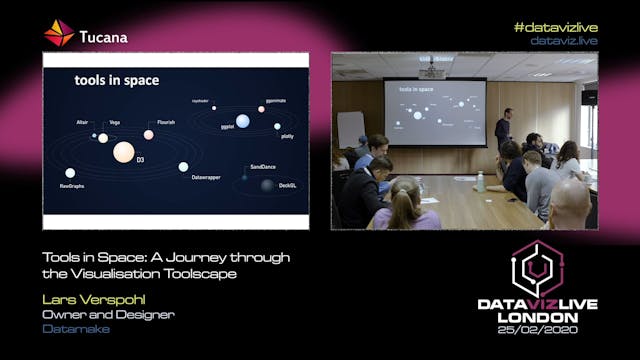
Tools in Space: A Journey through the...
Data visualisation tools grow in number, spectrum and sophistication. This talk aims at providing a brief overview of the space from low level programming languages to high level click and show tools.
- The tool space
- Programming languages
- Online Templates
- Vector tools
- Special mentions...
-
User Testing for DataViz: Challenge, ...
User testing is recognised as a useful dimension of User Experience design. In the field of data visualisation, user testing can be a tricky but necessary challenge, as it involves testing new forms of interaction and communication. In this session, recorded live in London, Caroline Goulard of Da...
-
Creating an Effective and Beautiful D...
During this talk, Nadieh will show you how to create a unique, effective (and even beautiful) chart using d3.js, which has become the main "tool" for doing (interactive) data visualisation online. Starting from an empty white browser window, she'll live-code and take you through all the nuts and ...