
Skills
Learn how to think more visually as a coding expert, or more analytically as a designer. This collection focuses on learning the business skills to flourish as an analyst or designer, as well as the technical skills to make use of the aplications and toolkits that are available, both open-source and commercial. From storytelling with data, to hand-sketching data visuals, to building advanced dashboards, to stakeholder management - you’ll find sessions that will widen your skillset and boost your career.

-
Effective Data Presentation in PowerPoint
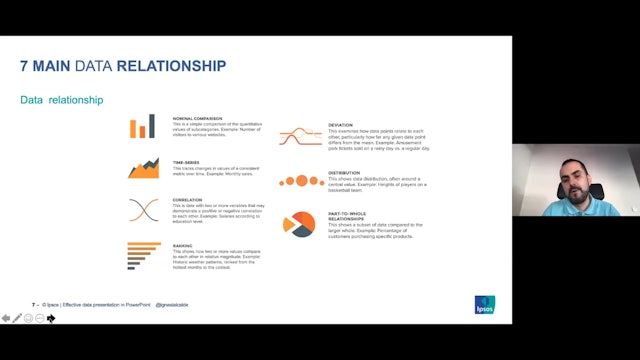
Clever Ways to Present Data Effectively in PowerPoint
Data presentation tips and tricks, and learn how to properly dissect data and visualise charts and tables, to to create clean and effective data presentation in PowerPoint.
-
Exploring Open-Source and Commercial Data Visualisation Tools
Data visualisation tools grow in number, spectrum and sophistication. This talk aims at providing a brief overview of the space from low level programming languages to high level click and show tools.
Key topics:
The tool space
- Programming languages
- Online Templates
- Vector tools
- Special... -
Best Practice and Tooling in Google Data Studio
An overview of what's possible, and advice on getting started with this free reporting and data visualisation tool.
-
Tools in Space: A Journey through the Visualisation Toolscape
Data visualisation tools grow in number, spectrum and sophistication. This talk aims at providing a brief overview of the space from low level programming languages to high level click and show tools.
- The tool space
- Programming languages
- Online Templates
- Vector tools
- Special mentions...
-
User Testing for DataViz: Challenge, Impact and Good Practice (Caroline Goulard)
User testing is recognised as a useful dimension of User Experience design. In the field of data visualisation, user testing can be a tricky but necessary challenge, as it involves testing new forms of interaction and communication. In this session, recorded live in London, Caroline Goulard of Da...
-
Creating an Effective and Beautiful Data Visualisation from Scratch
During this talk, Nadieh will show you how to create a unique, effective (and even beautiful) chart using d3.js, which has become the main "tool" for doing (interactive) data visualisation online. Starting from an empty white browser window, she'll live-code and take you through all the nuts and ...
-
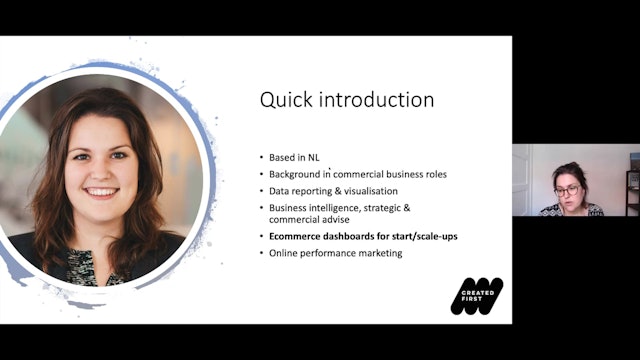
How to Flourish at Data Visualisation and Storytelling (Lyndsey Pereira)
In this session, Lyndsey will teach a simple framework for thinking about and creating good data visualisation designs.She shows how to create impactful data visualisations and stories that engage readers and audiences.
Lyndsey will explore the tool "Flourish" as a means to quickly create beauti...
-
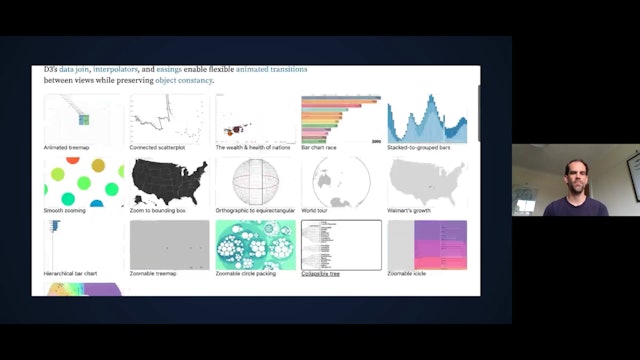
Navigating the Learning Landscape for d3.js (Ian Johnson)
Take a helicopter tour of d3's thousand API methods, tens of thousands of open source examples, and see the landmark learning resources and local community spots.
If you've been thinking about learning d3 but are not sure where to start, this talk is for you!
-
Stakeholder Collaboration Skills for More Effective Analytics (Steve Hulmes)
Many of the frustrations and challenges analysts experience are actually rooted in their engagement with stakeholders and the rest of the organisation. This is compounded by the fact that many teams, often unknowingly, revert to a passive model of working, especially when they are busy - it's a m...
-
Data Analytics for StarCraft II
All too often in the Business Intelligence world we are focussed on business applications and business objectives to the extent of pigeon-holing ourselves and our skills. While community projects set up and hosted by others provide easy participation, they're rarely topics we feel passionate abou...
-
Beyond Charting: Understanding Data Types and Relationships