
Strategy
Data Literacy · Building Capability · Governance and Adoption · Culture and Ethics
For leaders in data visualisation, business intelligence, analytics and internal/external communications.
Learn how leading organisations are building teams and capability to create high-impact visuals and dashboards. Hear advice on leading a team of analysts and developers, on building data literacy in your internal or external audience, on designing effective and scalable governance, and on ensuring that your messaging strategy is effective, culturally sensitive, and ethically sound.

-
Building Internal Data Visualisation Communities
Most successful companies strive to be data-driven organisations in order to grow and achieve success. We'll look at the importance of an organisational data culture and how a data community can really help achieve this from the ground up.
Key topics:
- Data culture
- Internal and External data... -
Making Public Data Accessible and Useful for All
-
Learning as we Go: How we Manage DataViz Teams
I co-manage a Belfast-based Data Visualisation team, working on Consulting projects across the UK. If you've ever led a data viz team, you'll know that it isn't always plain sailing; training, resourcing and empowering team members is an ongoing commitment. Our team is still learning as we go, bu...
-
Structure, Consistency, Speed: How JLL Architected their Viz Design
How do we help our clients & people see and understand data? We standardised. Empowering analysts with consistent and considered guidelines, world class training and the sharing of community innovation, we have elevated design skills to deliver calm, elegant visuals that communicate accessible in...
-
Data Literacy: What the Heck is it and Why is it so Important?
Sarah Nell-Rodriquez - Principal High Touch Customer Success Manager, Salesforce
Data Literacy is a popular word these days. Go to any data chat, and you'll see these two words bandied about by many. Some argue about the term itself, and others compare it to data visualisation skills. With so ma...
-
Key Traits of High-Performing Analysts
The practical steps you and your team can take to take to improve your stakeholder engagement, and elevate your impact and productivity.
Drawing on his 30 years of experience managing, training and coaching analysts across a breadth of disciplines and industries, Steve shares the common key mind...
-
Designing a More Transparent & Literate Data Ecosystem
Data Literacy levels in society and business are holding back the benefist of a data driven business ecosystem with levels of distrust amongst the public being another key issue to resolve.
As part of a commitment to transparency, Experian are working to educate people on how we use their data an... -
Enabling the Analysts: From Apprentices to Artisans at Groupon
Suitable for leaders within BI/Data Analyst departments in organisations, as well as analysts.
Within large organisations, typically analysts lack the opportunities to be more involved in their projects, losing out on the opportunity to grow within an organisation by providing more visually enga...
-
Data & Information Design-as-a-Service
In our changing world, the need for reliable information to make solid decisions has never been more important than now. Our customers need much more than a data provider, they need a partner that can generate relevant and accurate information to turn it into actionable truths.
We will explain h...
-
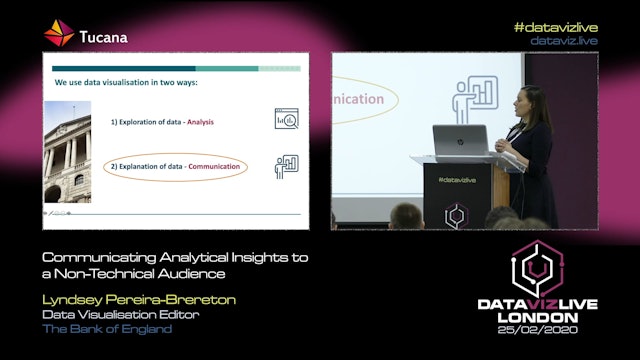
Communicating Analytical Insights to a Non-Technical Audience
High level presentation for non-experts and/or Leaders who want to understand why data vis is important for communication and how they can improve this at their organisations.
The Bank of England wanted to update and improve the effectiveness of it's analytical communication. But the charts used...
-
Visualisation in the COVID Era (Andy Kirk)
Few topics have dominated the news so completely as Covid-19 has this year, and people have been exposed to data on infections, mortality and financial impact in the news on a daily basis. The effect of this on how people consume data has been significant, and it represents a challenge and an opp...
-
Applying Racial Equity Awareness in Data Visualisation (Jon Schwabish)
Just as organisations often carefully considered the words they use in written reports and platforms, they should be equally careful in how they visually present data to their readers, users, and audiences and what words they should use in and around those visuals.
This talk encourages data comm...
-
Data Literacy: A Critical Element to Building a Data-Driven Culture (Salesforce)
Data Literacy is the bedrock of a data-driven organisation. To be truly data-driven, an organisation must have an embedded data culture. That means there must be a global understanding of the value of data, and how to consume and apply the insights that are provided by visualisations and dashboar...
-
Building a Data-Driven Culture and Organisation (Jordan Morrow)