-
 45:29Episode 1
The Little of Data Visualisation
Episode 1
Exclusive workshop with Andy Kirk, part of DataVizLive - November 2020
-
Beyond Open Washing: Are Narratives the Future of Open Data Portals?
Episode 2
-
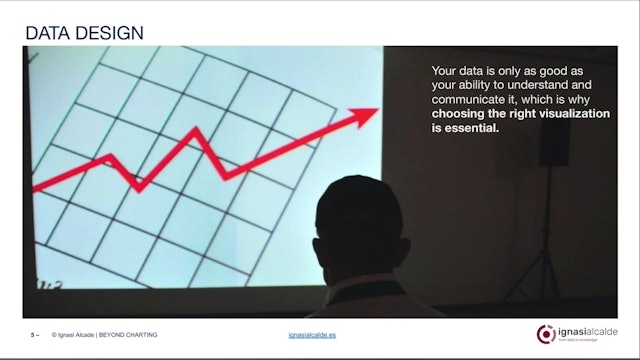
Beyond Charting: Understanding Data Types and Relationships
Episode 3
-
 22:30Episode 4
Data Analytics for StarCraft II
Episode 4
All too often in the Business Intelligence world we are focussed on business applications and business objectives to the extent of pigeon-holing ourselves and our skills. While community projects set up and hosted by others provide easy participation, they're rarely topics we feel passionate abou...
-
Stakeholder Collaboration Skills for More Effective Analytics (Steve Hulmes)
Episode 5
Many of the frustrations and challenges analysts experience are actually rooted in their engagement with stakeholders and the rest of the organisation. This is compounded by the fact that many teams, often unknowingly, revert to a passive model of working, especially when they are busy - it's a m...
-
Beyond Data Visualisation: The Softer Skills that Analysts Need
Episode 6
An introduction to the soft skills that analysts and data visualisers need, in addition to their technical skills. The session includes a walkthrough of a 9-Step Model for effective analysis that identifies the soft skills needed at each stage. Paul Laughlin brings to life why these skills are cr...
-
Building a Data-Driven Culture and Organisation (Jordan Morrow)
Episode 7
-
 29:48Episode 8
Colouring with Data (Alan Wilson)
Episode 8
Colour is a powerful but dangerous communication tool. In this session, Alan Wilson, one of Adobe's most senior design leaders, explains how to use colour effectively when visualising data. He also shows the perils of incorrect colour choice, and when not to use colour at all.
-
Navigating the Learning Landscape for d3.js (Ian Johnson)
Episode 9
Take a helicopter tour of d3's thousand API methods, tens of thousands of open source examples, and see the landmark learning resources and local community spots.
If you've been thinking about learning d3 but are not sure where to start, this talk is for you!
-
Data Literacy: A Critical Element to Building a Data-Driven Culture (Salesforce)
Episode 10
Data Literacy is the bedrock of a data-driven organisation. To be truly data-driven, an organisation must have an embedded data culture. That means there must be a global understanding of the value of data, and how to consume and apply the insights that are provided by visualisations and dashboar...
-
Offline Marketing & Digital KPI's: How can you Bridge the Gap? (Alice Speranza)
Episode 11
Linking offline marketing activities to digital engagement KPIs can often be a challenge for marketing teams, especially when campaigns are executed by external agencies, who might not have access to useful data points and knowledge.
This presentation will talk about how The Economist data team ...
-
How to Flourish at Data Visualisation and Storytelling (Lyndsey Pereira)
Episode 12
In this session, Lyndsey will teach a simple framework for thinking about and creating good data visualisation designs.She shows how to create impactful data visualisations and stories that engage readers and audiences.
Lyndsey will explore the tool "Flourish" as a means to quickly create beauti...
-
Applying Racial Equity Awareness in Data Visualisation (Jon Schwabish)
Episode 13
Just as organisations often carefully considered the words they use in written reports and platforms, they should be equally careful in how they visually present data to their readers, users, and audiences and what words they should use in and around those visuals.
This talk encourages data comm...
-
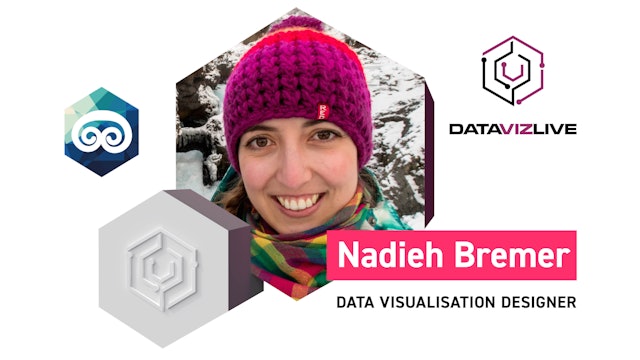
Creating an Effective and Beautiful Data Visualisation from Scratch
Episode 14
During this talk, Nadieh will show you how to create a unique, effective (and even beautiful) chart using d3.js, which has become the main "tool" for doing (interactive) data visualisation online. Starting from an empty white browser window, she'll live-code and take you through all the nuts and ...
-
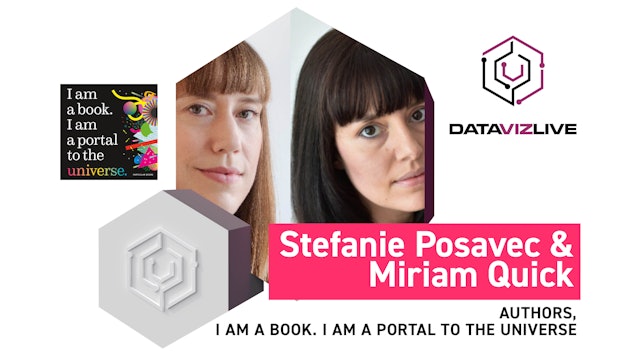
New, Art-Inspired Approaches in DataViz (Stefanie Posavec, Miriam Quick)
Episode 15
Miriam Quick is a data journalist and researcher and Stefanie Posavec is a designer and artist. They have spent much of their shared practice exploring how to move data visualisation 'beyond the bar chart' and extending what is possible in the realm of presenting and experiencing data.
Alongside...
-
 39:40Episode 16
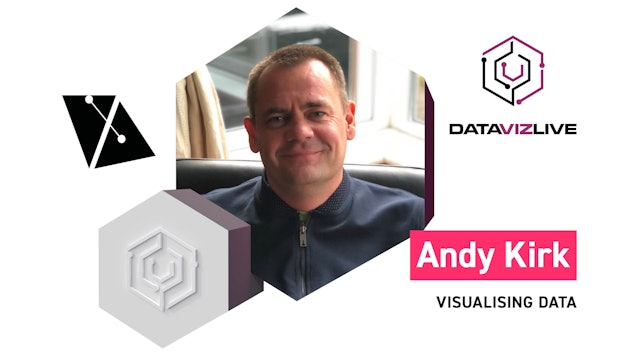
Visualisation in the COVID Era (Andy Kirk)
Episode 16
Few topics have dominated the news so completely as Covid-19 has this year, and people have been exposed to data on infections, mortality and financial impact in the news on a daily basis. The effect of this on how people consume data has been significant, and it represents a challenge and an opp...